On this page
- What LLM observability covers (and what logging misses)
- What to monitor on an AI agent in production
- LLM tracing with OpenTelemetry GenAI conventions
- AI observability tools compared: Langfuse, LangSmith, Phoenix, Datadog, Helicone
- LLM cost monitoring: from tokens to cost per task
- Quality evals and drift: the part that tells you if cost cuts are safe
- Worked example: a month of AI agent monitoring, priced
- Budgets and alerts that catch problems before the invoice
- How to set up LLM observability in a week
- Frequently asked questions
- What we’d do first
The invoice is usually how teams find out. A support agent that cost $300 in its first month costs $2,100 in its third, and nobody can say whether that is more customers, longer conversations, a retry loop, or a prompt change someone shipped on a Friday. The provider dashboard shows tokens per API key. It cannot show which feature, which customer or which step of the agent burned them.
LLM observability closes that gap. In practice it means every model call, tool call and retrieval your agent makes is recorded as a span inside a trace, tagged with the feature and customer it served, priced, timed and scored for quality. Get that in place and the questions above take minutes to answer. This guide covers what we actually instrument on production agents, the OpenTelemetry conventions worth following, how Langfuse, LangSmith, Arize Phoenix, Datadog and Helicone compare in November 2026, and a worked monthly bill that shows where the money goes, including the part most teams forget: the cost of watching.
Key takeaways
- Track cost per completed task, not cost per call. A cheap call that fails and retries three times is an expensive task.
- Instrument with OpenTelemetry’s
gen_ai.*attributes even though the GenAI conventions are still marked Development. Switching backends later then costs a config change instead of a rewrite. - Quality evals usually cost more than the tracing tool. In our worked example, sampled LLM-as-a-judge scoring is about twice the Langfuse bill.
- Helicone went into maintenance mode after Mintlify acquired it in March 2026. Don’t start a new project on it.
- Alert on rates and ratios (cost per task, error rate, eval pass rate) rather than raw totals, which rise every time you grow.
What LLM observability covers (and what logging misses)
LLM observability is tracing plus pricing plus quality scoring for every request an AI feature handles. Ordinary application monitoring tells you a request took 4.2 seconds and returned a 200. It won’t tell you the answer was wrong, or that retrieval stuffed in twelve documents.
Three things make AI workloads different from the APIs your APM was built for:
- A 200 can still be a failure. The model answered confidently and incorrectly. Only an evaluation catches that.
- Cost varies per request by 100x or more. One user asks a yes/no question, another pastes a contract. Averages hide the long tail that drives the bill.
- Agents branch. One user message can fan out into a dozen calls, and the broken step is often four levels deep.
So the unit of observation is the trace: one root span per user task, with a child span for each model call, tool execution and retrieval.

What to monitor on an AI agent in production
Monitor six signals: cost per task, tokens, latency, errors, quality scores and drift. The first five are per-trace numbers you can chart today. Drift is those same numbers compared against last week.
Cost per task
Sum the cost of every span under a root and divide by tasks that actually finished. For a support agent, that means resolved conversations, not conversations started. It is also how you tell whether a cheaper model saved money or just shifted work to retries.
Tokens, split by type
Record input and output separately, and split cached input from uncached. Reasoning models add a third bucket: hidden reasoning tokens billed as output. If your tool only sees total tokens, it cannot tell you whether prompt caching is working, and on most agents we review that is the single biggest pricing lever. We cover the levers themselves in our guide to reducing LLM costs, so this post stays on measurement.
Latency, two numbers
Time to first token is what a chat user feels; total duration is what an agent step feels. Track p50 and p95 for both. A p95 that doubles while p50 stays flat usually means a slow tool, not a slow model.
Errors, including the quiet ones
Count provider errors (429s, 5xx, timeouts) and tool failures, but also the ones that don’t throw: a length finish reason that truncated an answer, a JSON output that failed to parse, an agent that hit its step limit. Step-limit hits are our favourite early warning for loops.
Quality evals
Score a sample of production traces automatically, with an LLM-as-a-judge or with code checks, plus thumbs-up and thumbs-down from users where you have them. Without a quality signal, every cost cut is a guess.
Drift
Watch for changes you didn’t make: input length creeping up, a new topic in user questions, a provider updating the model behind an alias. Pin model versions and alert when the response’s model differs from the one requested.
LLM tracing with OpenTelemetry GenAI conventions
Use OpenTelemetry’s GenAI semantic conventions as your span schema, even though they are not stable yet. They define standard names for the model, provider, token counts and finish reasons, so a trace written once can be read by Langfuse, Phoenix, Datadog or any OTLP backend.
The status matters. The conventions now live in their own repository, and its README lists them as Development, covering model spans, agent spans, events, metrics and exceptions, plus provider-specific pages for Anthropic, AWS Bedrock, Azure AI Inference and OpenAI. That move confuses people: the main OpenTelemetry attribute registry now shows the gen_ai.* attributes as deprecated. They were relocated, not abandoned.
The attributes you will use most, as described in OpenTelemetry’s May 2026 GenAI observability post:
gen_ai.request.modelfor the model you asked forgen_ai.usage.input_tokensandgen_ai.usage.output_tokensper callgen_ai.response.finish_reasons, which is where truncation and tool-call stops show up- Two metrics:
gen_ai.client.operation.durationandgen_ai.client.token.usage, both histograms
The same post makes a point we agree with strongly. By default, no prompt or completion content is captured, only metadata. Content capture is an explicit opt-in because prompts carry customer data. Turn it on deliberately, per environment.
On top of the standard attributes, add your own business tags. These are what turn tracing into cost attribution:
from opentelemetry import trace

tracer = trace.get_tracer("support-agent")

with tracer.start_as_current_span("invoke_agent support_agent") as span:
    span.set_attribute("gen_ai.operation.name", "invoke_agent")
    span.set_attribute("gen_ai.agent.name", "support_agent")
    # our own tags, kept low-cardinality
    span.set_attribute("app.feature", "order-status")
    span.set_attribute("app.customer_tier", "pro")
    span.set_attribute("app.prompt_version", "v14")
    result = run_agent(message)
From our team: keep tag values bounded. Feature names, plan tiers and prompt versions are fine. Raw user IDs belong on the trace as an identifier, not as a metric dimension, or your observability bill will grow faster than your model bill.
AI observability tools compared: Langfuse, LangSmith, Phoenix, Datadog, Helicone
For most teams we’d start with Langfuse; choose LangSmith if you are already deep in LangGraph, Phoenix if you want free self-hosting with strong evals, and Datadog if your platform team already lives there. Skip Helicone for new work.
| Tool | Published starting price | Billed on | Self-host | Pick it when |
|---|---|---|---|---|
| Langfuse | Free Hobby (50k units, 30 days); Core $29/mo with 100k units; Pro $199/mo | Units: $8 per 100k over the included amount | Yes, open source | You want one place for traces, prompts and evals at low cost |
| LangSmith | Developer $0 (5k traces); Plus $39 per seat (10k traces) | Traces, pay as you go, base retention 14 days | Enterprise only | Your agents are built on LangChain or LangGraph |
| Arize Phoenix | Free to self-host, no feature gates | Your own infrastructure | Yes, Elastic License 2.0 | You want evals and experiments without a SaaS bill |
| Datadog | $160/mo annual for the first 100k LLM spans, 15-day retention | $3.50 per 10k further spans (annual, 15 days) | No | Your APM, logs and on-call already run on Datadog |
| Helicone | n/a for new projects | n/a | Open source | Only if you already run it and have a migration plan |
Sources for the table: Langfuse pricing, LangSmith pricing, the Phoenix license page and Datadog’s price list, which now files the product under Agent Observability. All were checked in November 2026.
Langfuse
Our default. A Langfuse unit is any trace, observation or score you store, so a ten-span agent run costs ten units. It accepts OpenTelemetry directly, prices calls from a model table you can override under Project Settings > Models, and stayed MIT-licensed at its core after ClickHouse acquired it in January 2026. Unit billing punishes chatty instrumentation, so drop low-value spans.
LangSmith
Smoothest if you are on LangGraph, where tracing is close to automatic. Seat pricing adds up for larger teams, self-hosting needs Enterprise, and base traces are kept only 14 days.
Arize Phoenix
Strongest free option for evaluation work. It runs locally or in Docker, speaks OpenTelemetry and the OpenInference spec, and has datasets and experiments built in. ELv2 is not an OSI license, which only matters if you plan to resell Phoenix as a hosted service.
Datadog
The right answer when the alternative is a second on-call tool, because AI traces live in the same account as your APM, logs and monitors. It is the most expensive per span here, and retention beyond 15 days costs more.
Helicone
When Mintlify acquired it in March 2026, the product moved into maintenance mode: security fixes and new models continue, and Mintlify said it would help customers migrate elsewhere. If you run it today, plan that move this quarter.
Watch out: proxy-based tools see only the model call. They cannot see the tool call that timed out or the retrieval that returned nothing, which is where agents usually break. For agents, use SDK or OpenTelemetry tracing, not a proxy alone.
LLM cost monitoring: from tokens to cost per task
LLM cost monitoring works when every span carries a price and every trace carries a feature and an outcome, so you can divide spend by finished work.
Most tools price spans for you by matching the model name to a price table. That breaks in three common cases, so check them in week one:
- Cached tokens double-counted. Some providers report cached tokens inside the input total. If your tool also counts them separately, cost is overstated.
- Reasoning tokens missing. If you infer tokens with a tokenizer instead of reading usage from the API response, hidden reasoning output never appears.
- Negotiated or self-hosted prices. A list-price table is wrong for committed-use discounts or your own GPUs. Override the price entries or send cost yourself.
Then reconcile monthly against the provider invoice. A few percent apart is normal. A 20% gap means untraced calls, usually a batch job someone forgot to instrument.
Quality evals and drift: the part that tells you if cost cuts are safe
Run automated evaluations on a sample of live traces so quality becomes a chart, not an anecdote. Otherwise a cheaper model looks like a pure win until the tickets arrive.
Langfuse’s docs put a typical LLM-as-a-judge run at $0.01 to $0.10 per assessment, depending on the judge model and input size. That’s why we sample. Score 100% of traces during a rollout, then drop to 5 to 10% in steady state, and always score traces with negative user feedback. The same page notes that trace-level evaluators are deprecated in favour of observation-level ones and keep running on Langfuse Cloud only until November 16, 2026. If you set yours up last year, migrate them now.
What we score on a typical support or shopping agent:
- Did the answer use the retrieved context, or invent details? (If retrieval is involved, our RAG explainer covers why this fails.)
- Did it complete the task the user asked for?
- Did it follow policy: refund limits, tone, no promises we can’t keep?
Version the judge prompt and check it against 50 to 100 human-labelled examples before trusting it. A judge that agrees with your team 70% of the time makes a fine trend line and a poor gate.
Worked example: a month of AI agent monitoring, priced
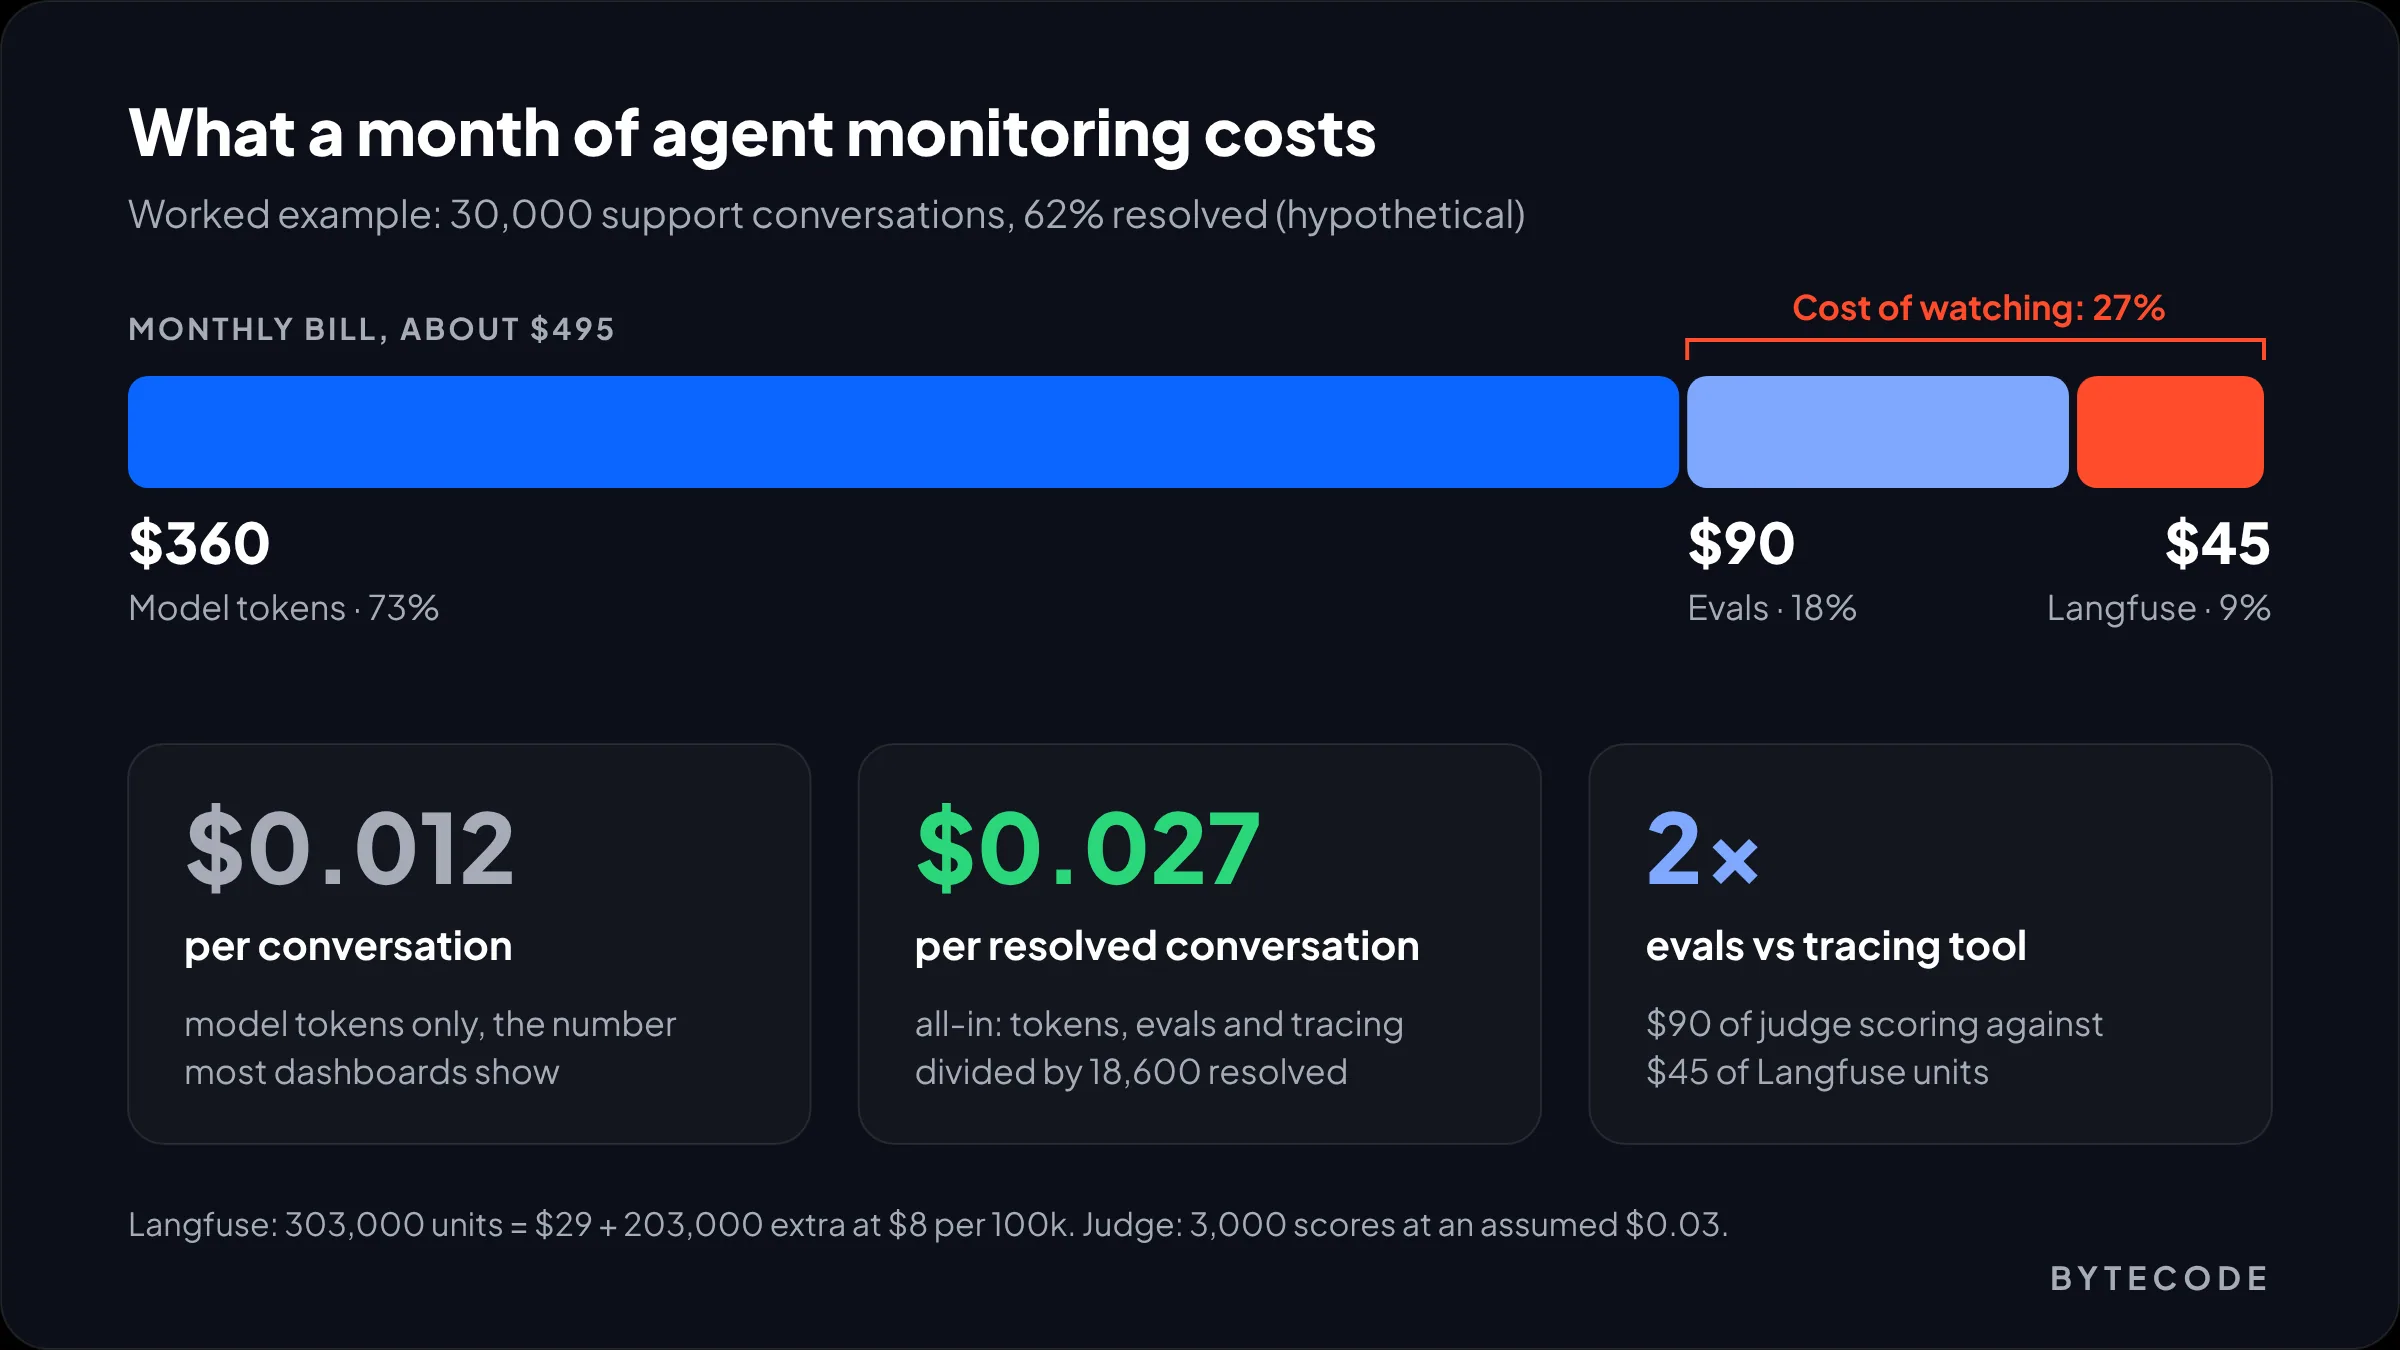
Here is a clearly hypothetical bill. Say a Shopify store runs a support agent handling 30,000 conversations a month. Each conversation is one trace with nine child spans (three model calls, four tool calls, one retrieval, one guardrail check). Average model spend is $0.012 per conversation, and 62% of conversations are resolved without a human.
| Line | Basis | Monthly cost |
|---|---|---|
| Model tokens | 30,000 × $0.012 | $360 |
| LLM-as-a-judge evals | 10% sample = 3,000 scores × $0.03 (assumed, within Langfuse’s $0.01–$0.10 range) | $90 |
| Langfuse Core | 30,000 traces + 270,000 observations + 3,000 scores = 303,000 units; $29 + 203,000 extra units at $8 per 100k | about $45 |
| Total | about $495 | |
| Cost per resolved conversation | $495 ÷ 18,600 resolved | about $0.027 |
The same 300,000 spans on Datadog would be about $230 a month on annual billing ($160 for the first 100k plus 20 × $3.50), assuming every span counts as an LLM span. Confirm that with Datadog first.
Three things stand out. Observability and evals together are 27% of the bill. The evals cost twice the tracing tool. And the headline number, $0.012 a conversation, understates the real cost per resolved task by more than half. That last figure is the one to put next to your human cost per ticket.
If you are still budgeting the build itself, our AI agent development cost guide covers the one-off side.
Want this bill worked out for your own agent?
Send us your monthly volume and the models you use, and we will map the spans, the alert rules and the expected cost of monitoring before you pick a tool.
Budgets and alerts that catch problems before the invoice
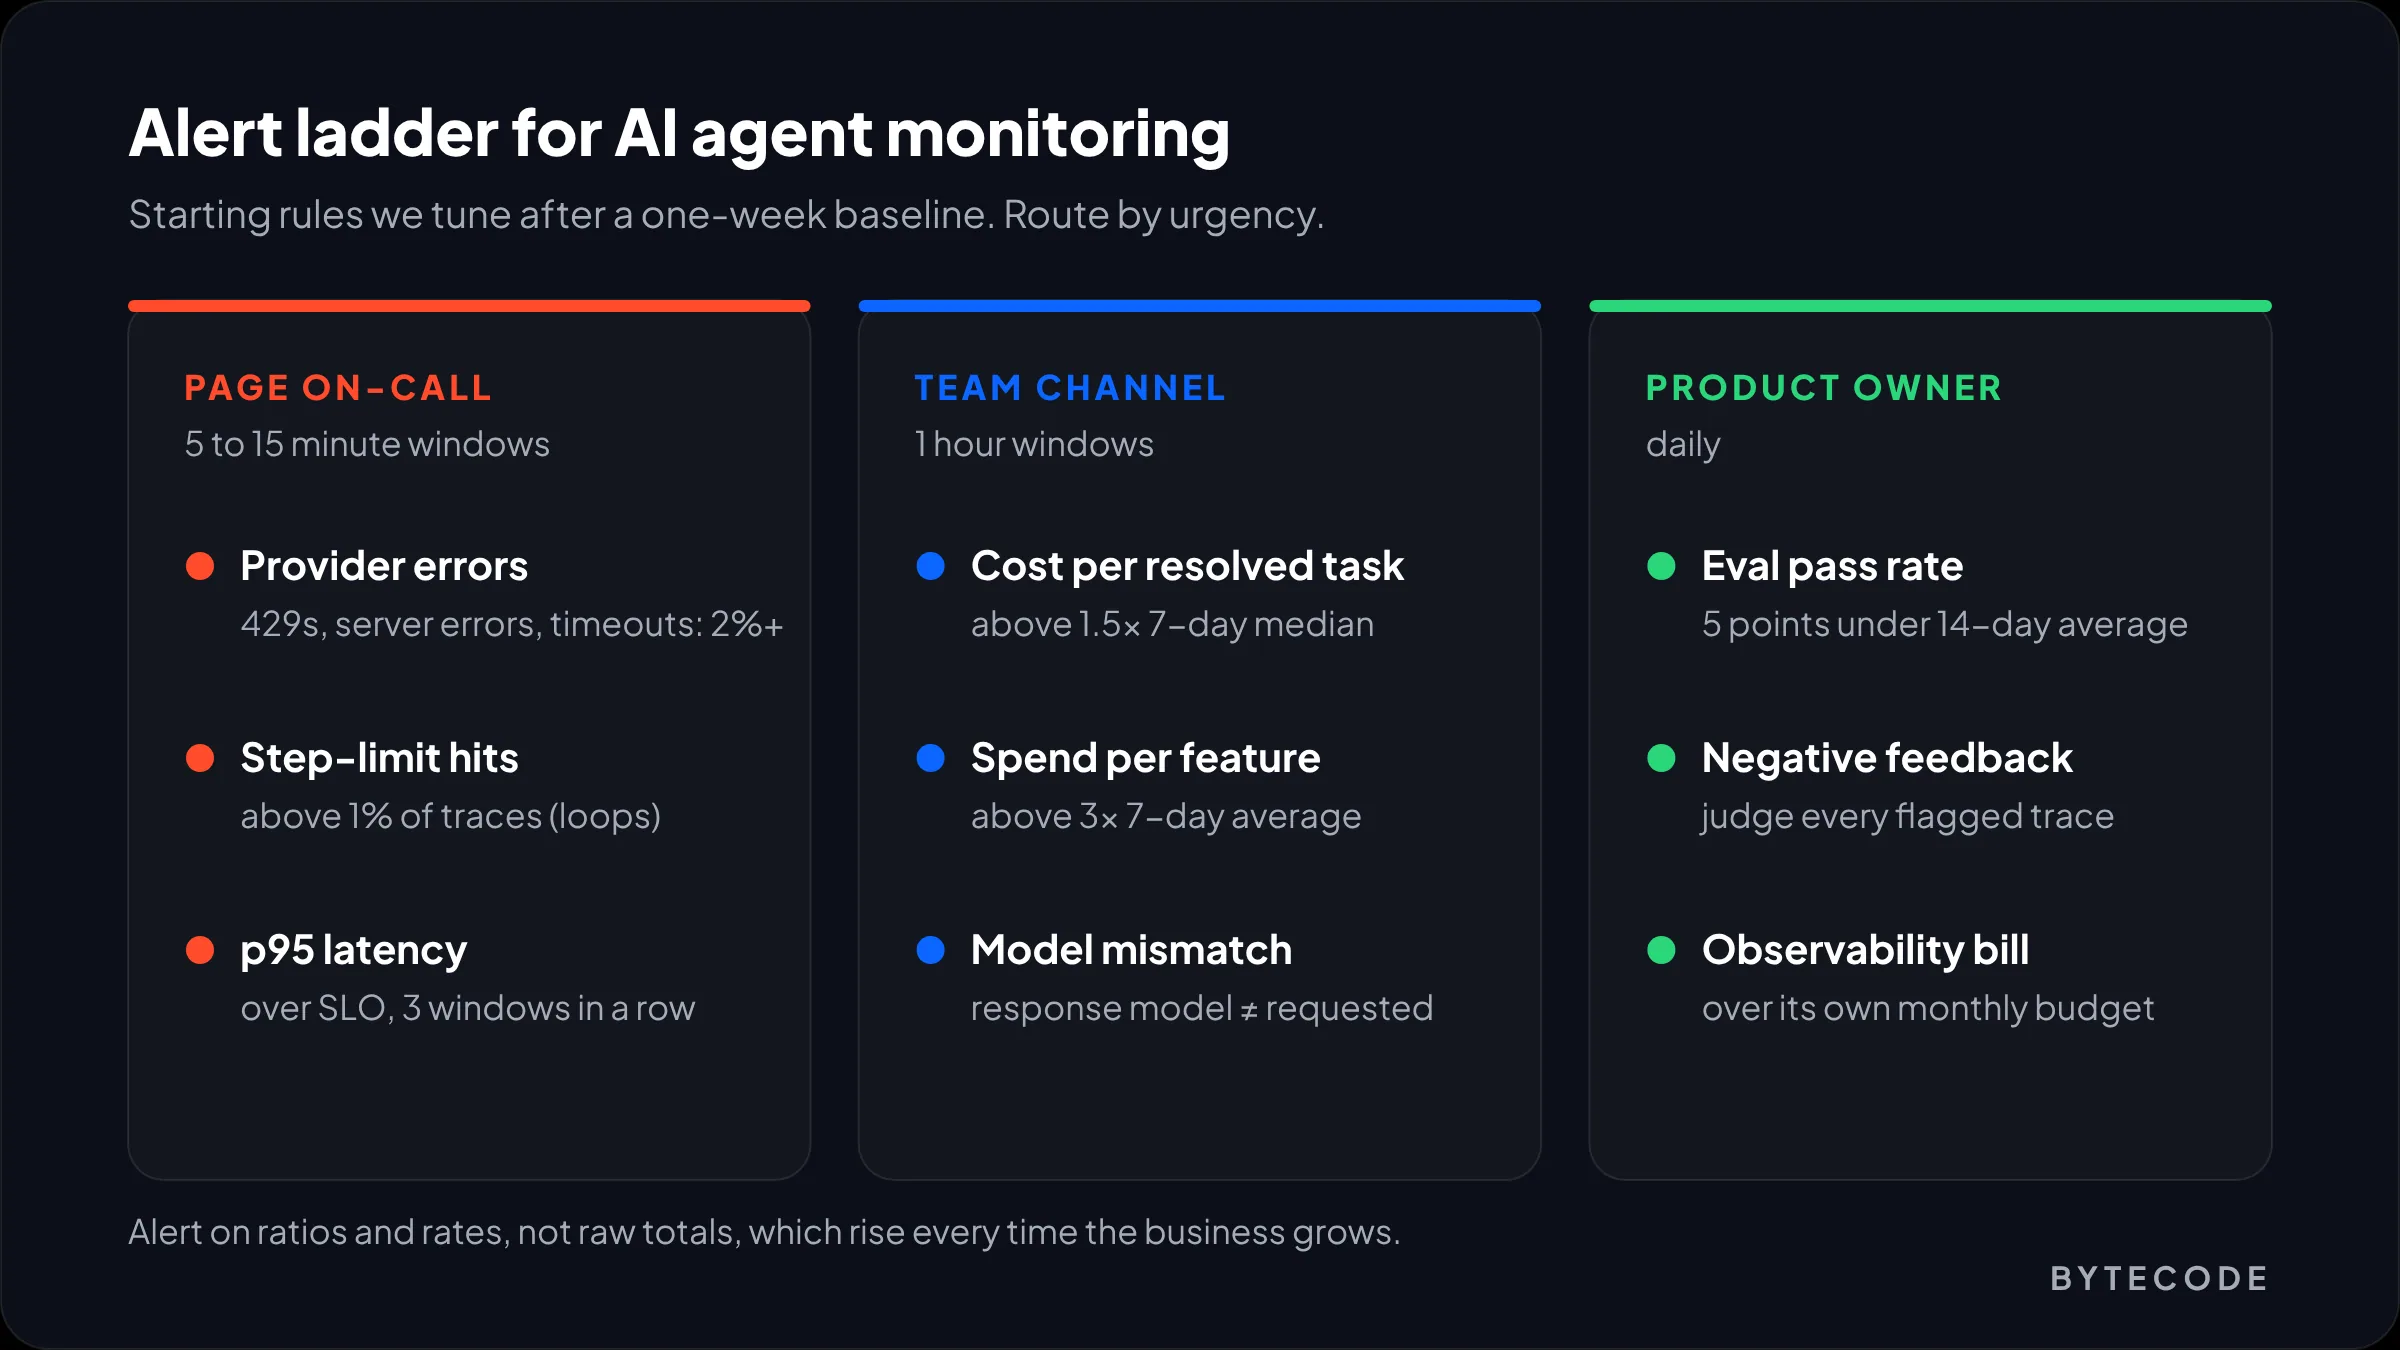
Set alerts on ratios and rates, with hard provider limits as a backstop. Raw totals rise every time the business grows, so people learn to ignore them.
Provider-side spend limits and per-project caps are covered in the budgets section of our cost guide. Inside the observability layer, these are the rules we start with and then tune:
| Signal | Starting rule | Window | Send to |
|---|---|---|---|
| Cost per resolved task | More than 1.5× its trailing 7-day median | 1 hour | Team channel |
| Spend per feature or customer | More than 3× its trailing 7-day average | 1 hour | Team channel |
| Agent step-limit hits | Any rise above 1% of traces | 15 minutes | On-call |
| Provider errors (429, 5xx, timeouts) | Above 2% of calls | 5 minutes | On-call |
| p95 total latency | Above your SLO for 3 windows in a row | 5 minutes | On-call |
| Eval pass rate | Drops 5 points below its 14-day average | 1 day | Product owner |
| Model mismatch | Response model differs from requested model | Any | Team channel |
Also alert on the observability bill itself. A debug flag left on can quietly double it.
How to set up LLM observability in a week
You can have useful tracing, cost attribution and a first set of alerts on a production agent within five working days. Here is the order we follow on our AI cost monitoring engagements:
- Day 1, inventory. List every place your code calls a model, batch jobs included.
- Day 1, pick the backend. Use the table above. If unsure, start on Langfuse Cloud or self-hosted Phoenix; because you are writing OpenTelemetry, the choice is reversible.
- Day 2, instrument. Add the framework integration or OpenTelemetry instrumentation, a root span per user task, and the business tags: feature, tier, prompt version, outcome.
- Day 3, verify cost. Compare a day of traced cost to the provider’s usage view. Fix cached-token and reasoning-token handling, and override prices where you have discounts.
- Day 3, decide on content capture. Opt in for staging. For production, capture content only if your privacy terms and retention settings allow it, or redact first.
- Day 4, evals. Write one judge for task completion, test it on labelled examples, then attach it to a 10% sample plus all negative-feedback traces.
- Day 5, alerts and a dashboard. Create the alert rules above and one dashboard with cost per resolved task, p95 latency, error rate and eval pass rate by feature.
Then wait a week before tuning thresholds. You need a baseline first.
From our team: the first week of real traces almost always shows one prompt or one tool doing far more work than anyone expected. Fix that before you shop for a cheaper model.
Frequently asked questions
What is LLM observability?
LLM observability is the practice of recording every model call, tool call and retrieval in an AI application as linked traces, then adding cost, latency, error and quality data to each one. It lets you answer why an answer was wrong, why a request was slow or why spend jumped, down to the specific step, feature and customer involved.
What is the difference between LLM monitoring and LLM observability?
Monitoring tells you that something changed, such as spend or error rate crossing a threshold. Observability lets you find out why, by opening the individual traces behind the change and seeing each prompt, tool call and token count. In practice you need both: alerts built on metrics, and traces detailed enough to debug what the alert found.
What are the best AI observability tools in 2026?
Langfuse is the strongest general choice for cost and features, with a free tier and plans from $29 a month. LangSmith suits teams on LangChain or LangGraph, Arize Phoenix is the best free self-hosted option for evals, and Datadog fits teams already using it for APM. Helicone is in maintenance mode after its March 2026 acquisition.
How do you monitor the cost of AI agents?
Trace each agent run as one root span with child spans for every model and tool call, record input, cached and output tokens on each, and tag the root with the feature, customer tier and outcome. Then chart cost per completed task by feature and alert when it rises well above its recent average, rather than watching the monthly total.
Are the OpenTelemetry GenAI semantic conventions stable?
No. As of November 2026 the GenAI conventions are marked Development and live in a dedicated OpenTelemetry repository, which is why the main attribute registry shows them as deprecated. They are still worth adopting, because Langfuse, Phoenix, Datadog and other backends accept them, so your instrumentation stays portable while names settle.
How much does LLM observability cost?
For a mid-sized agent, often less than the evaluations you run on top of it. Langfuse Core is $29 a month for 100,000 units plus $8 per extra 100,000, and Datadog starts at $160 a month on annual billing for 100,000 LLM spans. LLM-as-a-judge scoring typically adds $0.01 to $0.10 per evaluated trace.
What we’d do first
Don’t start by comparing tools. Start by deciding what a finished task is for each AI feature you run, because cost per finished task is the number every later decision depends on. Then add one root span per task with feature and outcome tags, written to OpenTelemetry conventions so the backend stays swappable.
After that, price every span, reconcile against one invoice, then add a sampled eval and the ratio alerts above. That catches loops, silent model changes and quality slides before customers or finance do. Tool choice matters less than people think. Tagging discipline matters more.
If you would rather have this set up and watched for you, our AI Cost Guard monitoring service instruments your agents, sets the budgets and alerts, and reviews the traces with you each month.